
 Share
Share
 Print
Print
|
|
|
|
|
Dashboard
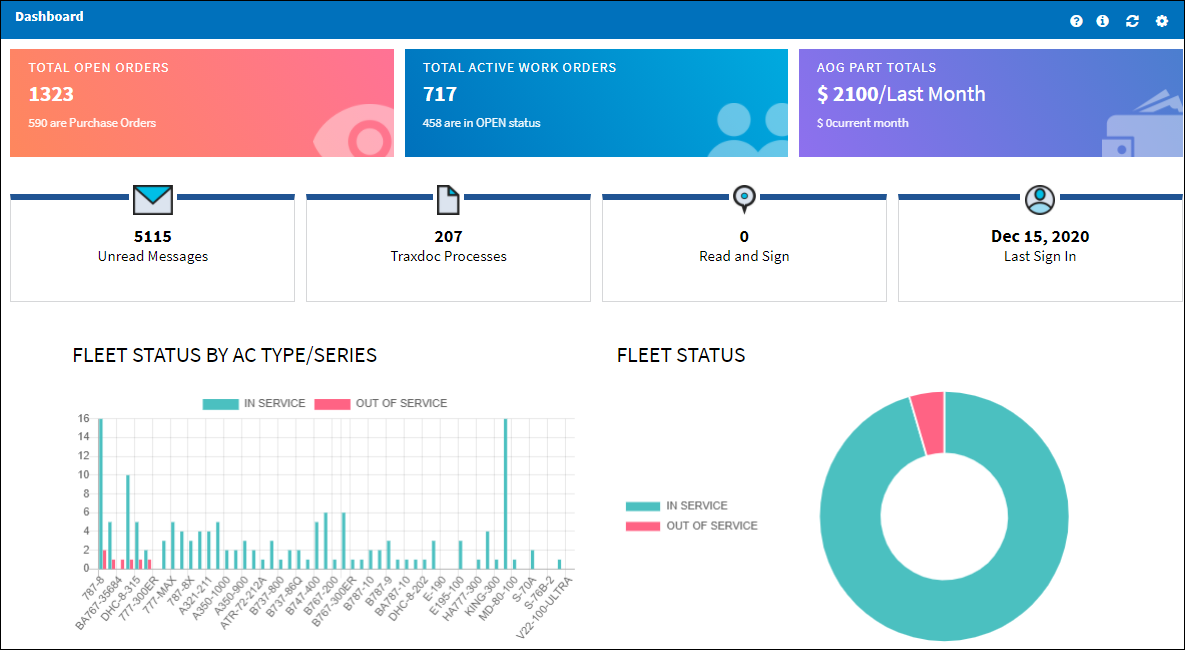
When the user first logs in to eMRO, they will be taken to the Dashboard. The Dashboard displays information such as the number of unread messages for the logged in user, information on TraxDoc Processes, Read and Sign and the last date the user was logged in to the system. The Dashboard also displays informational graphs such as Fleet Status, Open Requisitions, etc.
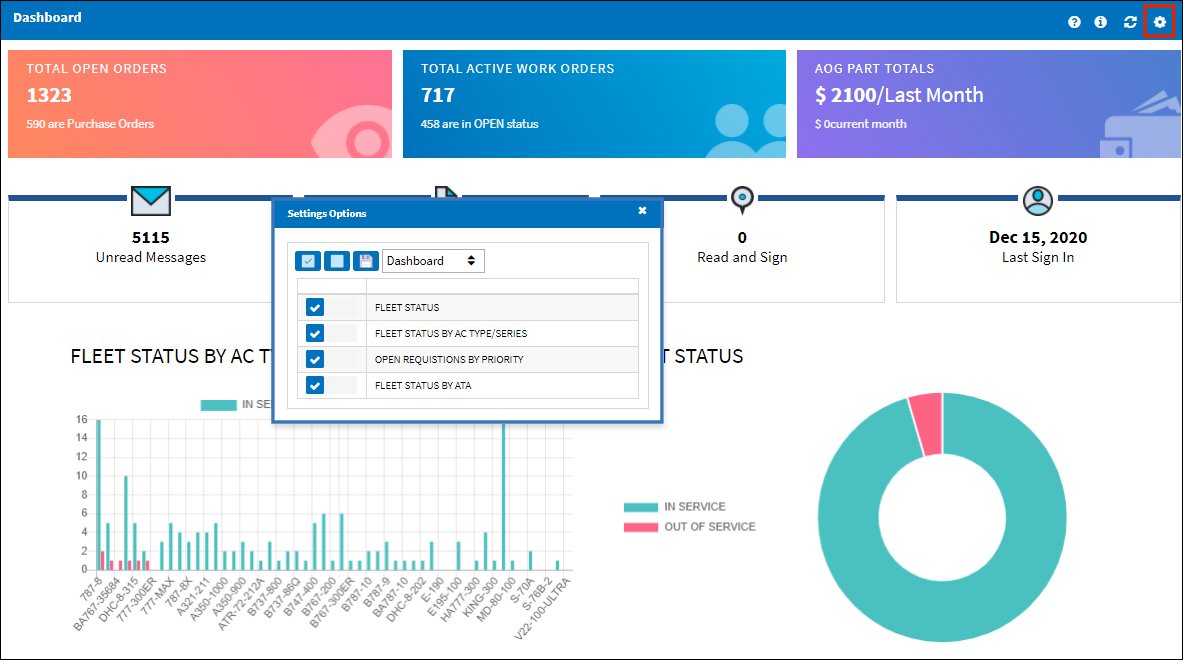
Which graphs appear on the Dashboard can be configured via the Dashboard Options ![]() button in the upper right-hand corner of the window. Graphs can be selected or deselected from this pop-up window.
button in the upper right-hand corner of the window. Graphs can be selected or deselected from this pop-up window.
![]()
![]() Note: New Jasper Report Prints can be displayed in the Dashboard window via the Dashboard Options button. These prints are security controlled via the Security Explorer and will only appear in the options menu when the user has security access and the Show on Dashboard checkbox has been selected in the Upload Custom Print window. For more information regarding the Show on Dashboard checkbox, please see eMRO Upload Custom Print, via the Settings/Update Menu module.
Note: New Jasper Report Prints can be displayed in the Dashboard window via the Dashboard Options button. These prints are security controlled via the Security Explorer and will only appear in the options menu when the user has security access and the Show on Dashboard checkbox has been selected in the Upload Custom Print window. For more information regarding the Show on Dashboard checkbox, please see eMRO Upload Custom Print, via the Settings/Update Menu module.
![]() Note: See Favorites Queue for additional information about removing windows from the Favorites tab in the Navigation Panel.
Note: See Favorites Queue for additional information about removing windows from the Favorites tab in the Navigation Panel.
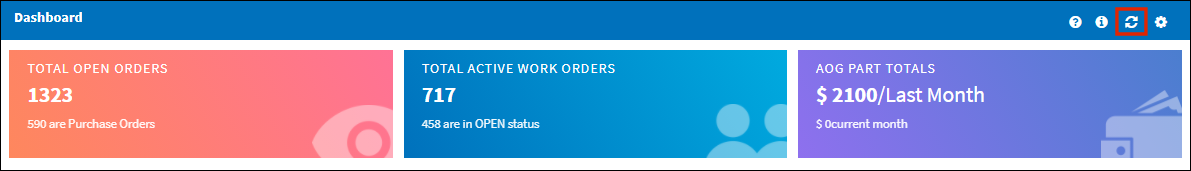
The graphs can be reset at any time to reflect a change in the display of your choosing with the Refresh Charts button.
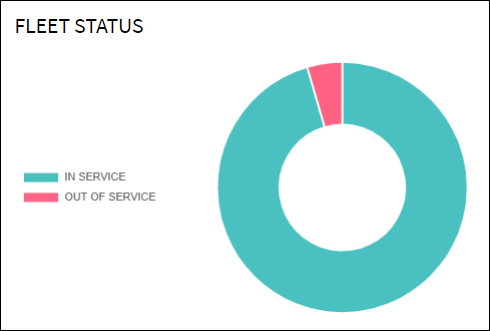
Fleet Status
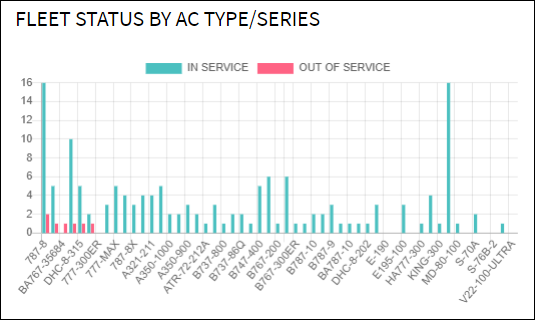
The following is a graphical display of all of the fleets that are currently In Service and Out of Service in your system.
The following bar graph illustrates fleet by A/C Type/Series both In and Out of Service.
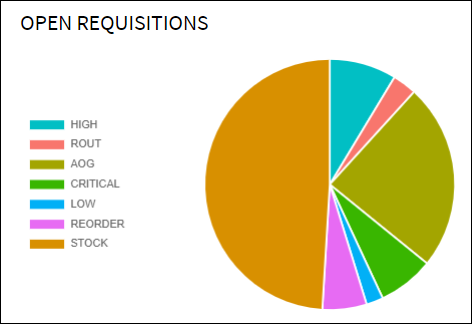
Open Requisitions
The following is a graphical display of all Open Requisitions by priority that are currently in your system.
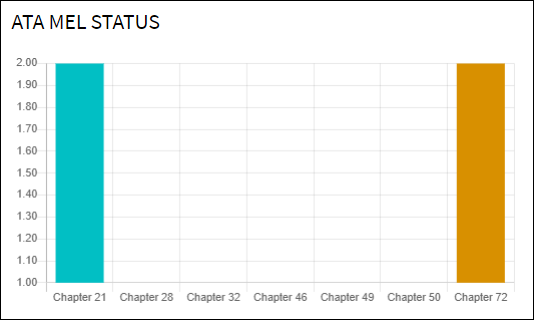
ATA MEL Status
The following is a graphical display of all Open MELs by ATA Chapter that are currently in your system.
Share
Print
|
©1997-2024 Trax USA Corp. All rights reserved. This manual may not be copied, photocopied, reproduced, translated, or converted to any electronic or machine-readable form, in whole or in part, without prior written approval from Trax USA Corp. |
|