
 Share
Share
 Print
Print
|
|
|
|
|
Capacity Tab
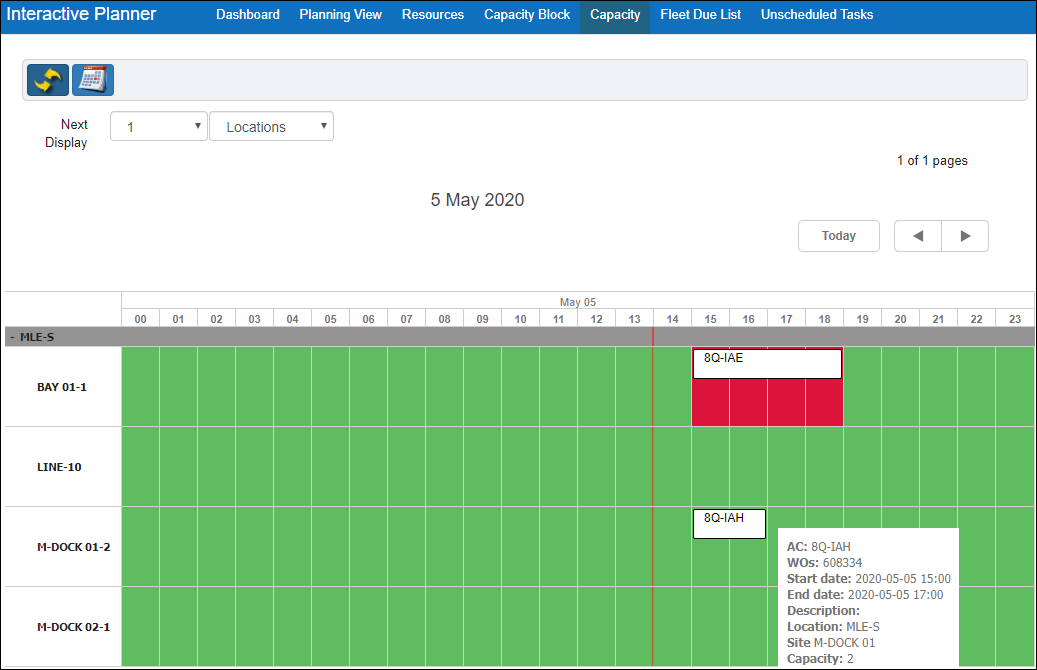
The Capacity tab provides a graphical display of locations, sites and the planned W/Os over a set period of time. When a site reaches its capacity the W/O is highlight with red, as shown below in the locations first site.
Note: This tab is informational.
The Calendar ![]() button is used to choose the date that the graph should start from.
button is used to choose the date that the graph should start from.
The Next Display drop down is used to select the number of days (1-5, or the entire month) data should be displayed for.

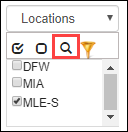
The Locations drop down is used to select the locations to appear in the graph. Once the location checkboxes have been selected, the Search button must be selected for the window to refresh and show the requested data.
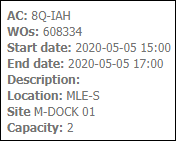
Once the results appear, select on a W/O to view its details, such as the start and end date, description, location and site, and the site capacity.
Share
Print
|
©1997-2024 Trax USA Corp. All rights reserved. This manual may not be copied, photocopied, reproduced, translated, or converted to any electronic or machine-readable form, in whole or in part, without prior written approval from Trax USA Corp. |
|