
 Share
Share
 Print
Print
|
|
|
|
|
Maint. Operations Board, via Resources

The Maintenance Operations Board is a live dashboard that displays the usage of production resources at main Locations. In the table below, users can view Planned Hours, Adjusted Available Hours, and Planned % for specific Locations and Sites.
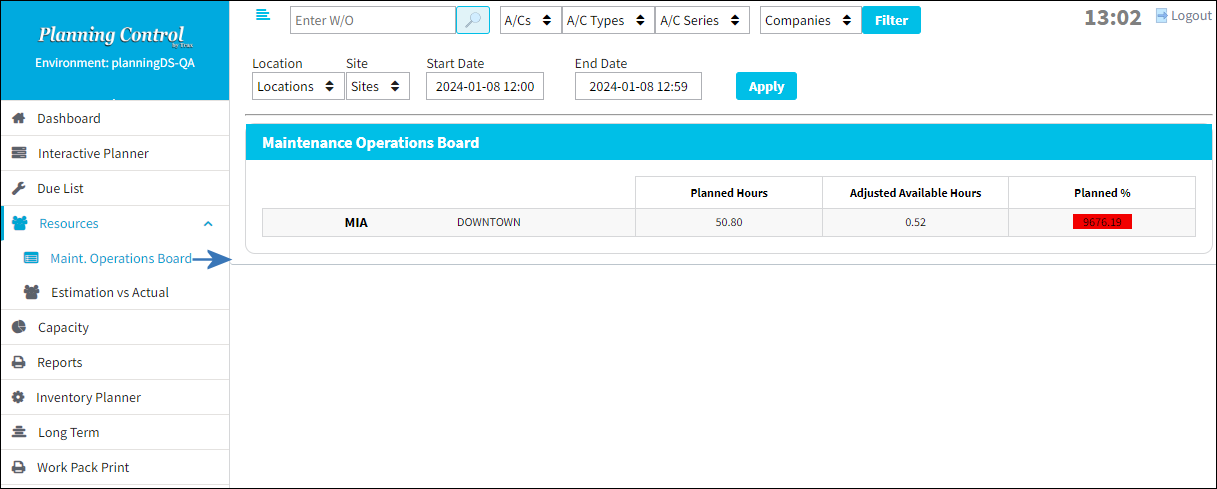
The following information/options are available in this window:
_____________________________________________________________________________________
Location drop-down
Allows users to filter the Maintenance Operation Board by the selected Location.
Site drop-down
Allows users to filter the Maintenance Operation Board by the selected Site.
Start Date/End Date
Allows users to filter the Maintenance Operation Board by the selected Start/End Date.
Apply button
Select to apply the the selected filters to the Maintenance Operations Board.
Location
The Location for maintenance events, inventory stores, orders, transactions, or training events.
Site
The Site where the work should be carried out (if applicable).
Planned Hours
The sum of Man Hours for all planned Work Orders for specific Locations and Sites.
Adjusted Available Hours
The sum of Available Man Hours for the specific Locations and Sites.
Planned %
The Total Hours divided by the Actual Available Hours multiplied by 100%. The Planned % cell will change color based on the calculated value.
Green - A green cell indicates that the Planned % is equal to/between 75% and 101%.
Yellow - A yellow cell indicates that the Planned % is less than 75%.
Red - A red cell indicates that the Planned % is greater than 101 %.
_____________________________________________________________________________________
Share
Print
|
©1997-2024 Trax USA Corp. All rights reserved. This manual may not be copied, photocopied, reproduced, translated, or converted to any electronic or machine-readable form, in whole or in part, without prior written approval from Trax USA Corp. |
|